HAMPTON CITY SCHOOLS EVERY CHILD, EVERY DAY, WHATEVER IT TAKES!
![]()
![]()
![]()
![]()
![]()
![]()
![]()
HAMPTON CITY SCHOOLS EVERY CHILD, EVERY DAY, WHATEVER IT TAKES!
![]()
![]()
![]()
![]()
![]()
![]()
![]()
RETURN TO HOME NEWS & ANNOUNCEMENTS GO TO NEWS ARCHIVES
Virginia Department of Education releases new data tool - Learning Needs Dashboard
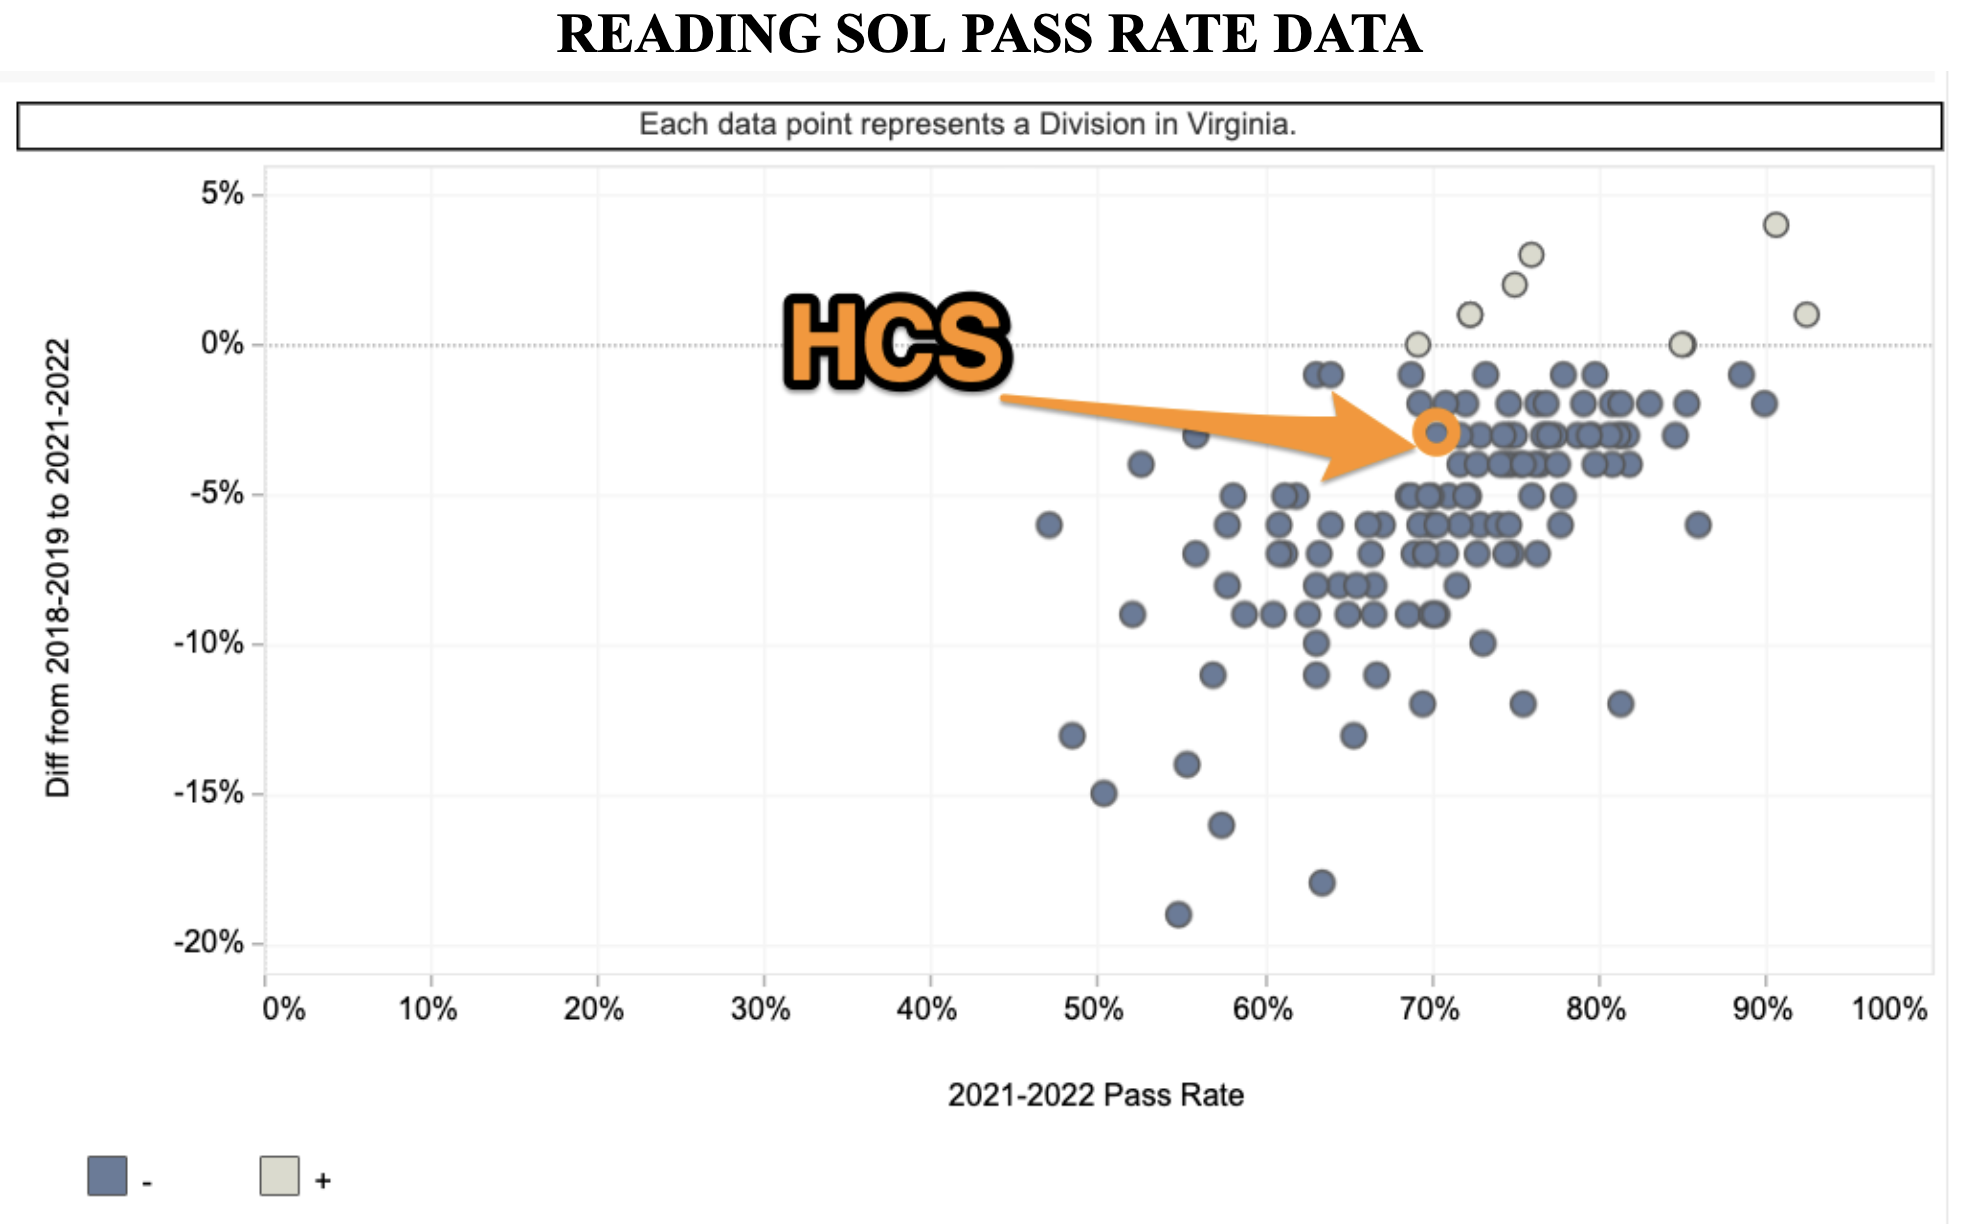
Wednesday, October 26, 2022, the Virginia Department of Education (VDOE) released a new data tool on its website called the Learning Needs Dashboard. This data tool is in addition to the VDOE’s School Quality Profiles Dashboard and presents SOL student performance data by school division for each tested area (i.e., Reading, History & Social Sciences, Mathematics, Science, Writing). The data are represented numerically as well as visually through the use of a table and scatter plots. The purpose of the new data tool is to highlight learning loss as a result of the pandemic by examining the change in student SOL performance (by division) through comparisons made between pass rates for spring 2019 versus spring 2022. The Learning Needs Dashboard shows the extent to which scores increased or decreased during the 2021-2022 school year when compared to scores from the 2018-2019 school year.
The table on the next page depicts the pass rate differential (comparing spring 2019 scores to spring 2022 scores) of HCS students by SOL assessment when compared to students from the other 131 school divisions across Virginia. Specifically, the table indicates 1) the number of divisions that have a greater learning loss than HCS, 2) the number of divisions showing the same learning loss as HCS, and 3) the number of divisions with a smaller learning loss than HCS and/or the divisions whose 2022 scores exceeded their 2019 scores.
SOL Test |
VA divisions with a greater learning loss than HCS when comparing spring 2019 scores to spring 2022 scores |
VA divisions with the same learning loss as HCS when comparing spring 2019 scores to spring 2022 scores |
VA divisions with a smaller learning loss than HCS when comparing spring 2019 scores to spring 2022 scores, and/or whose pass rates were higher for spring 2022 |
Reading |
86 |
18 |
27 |
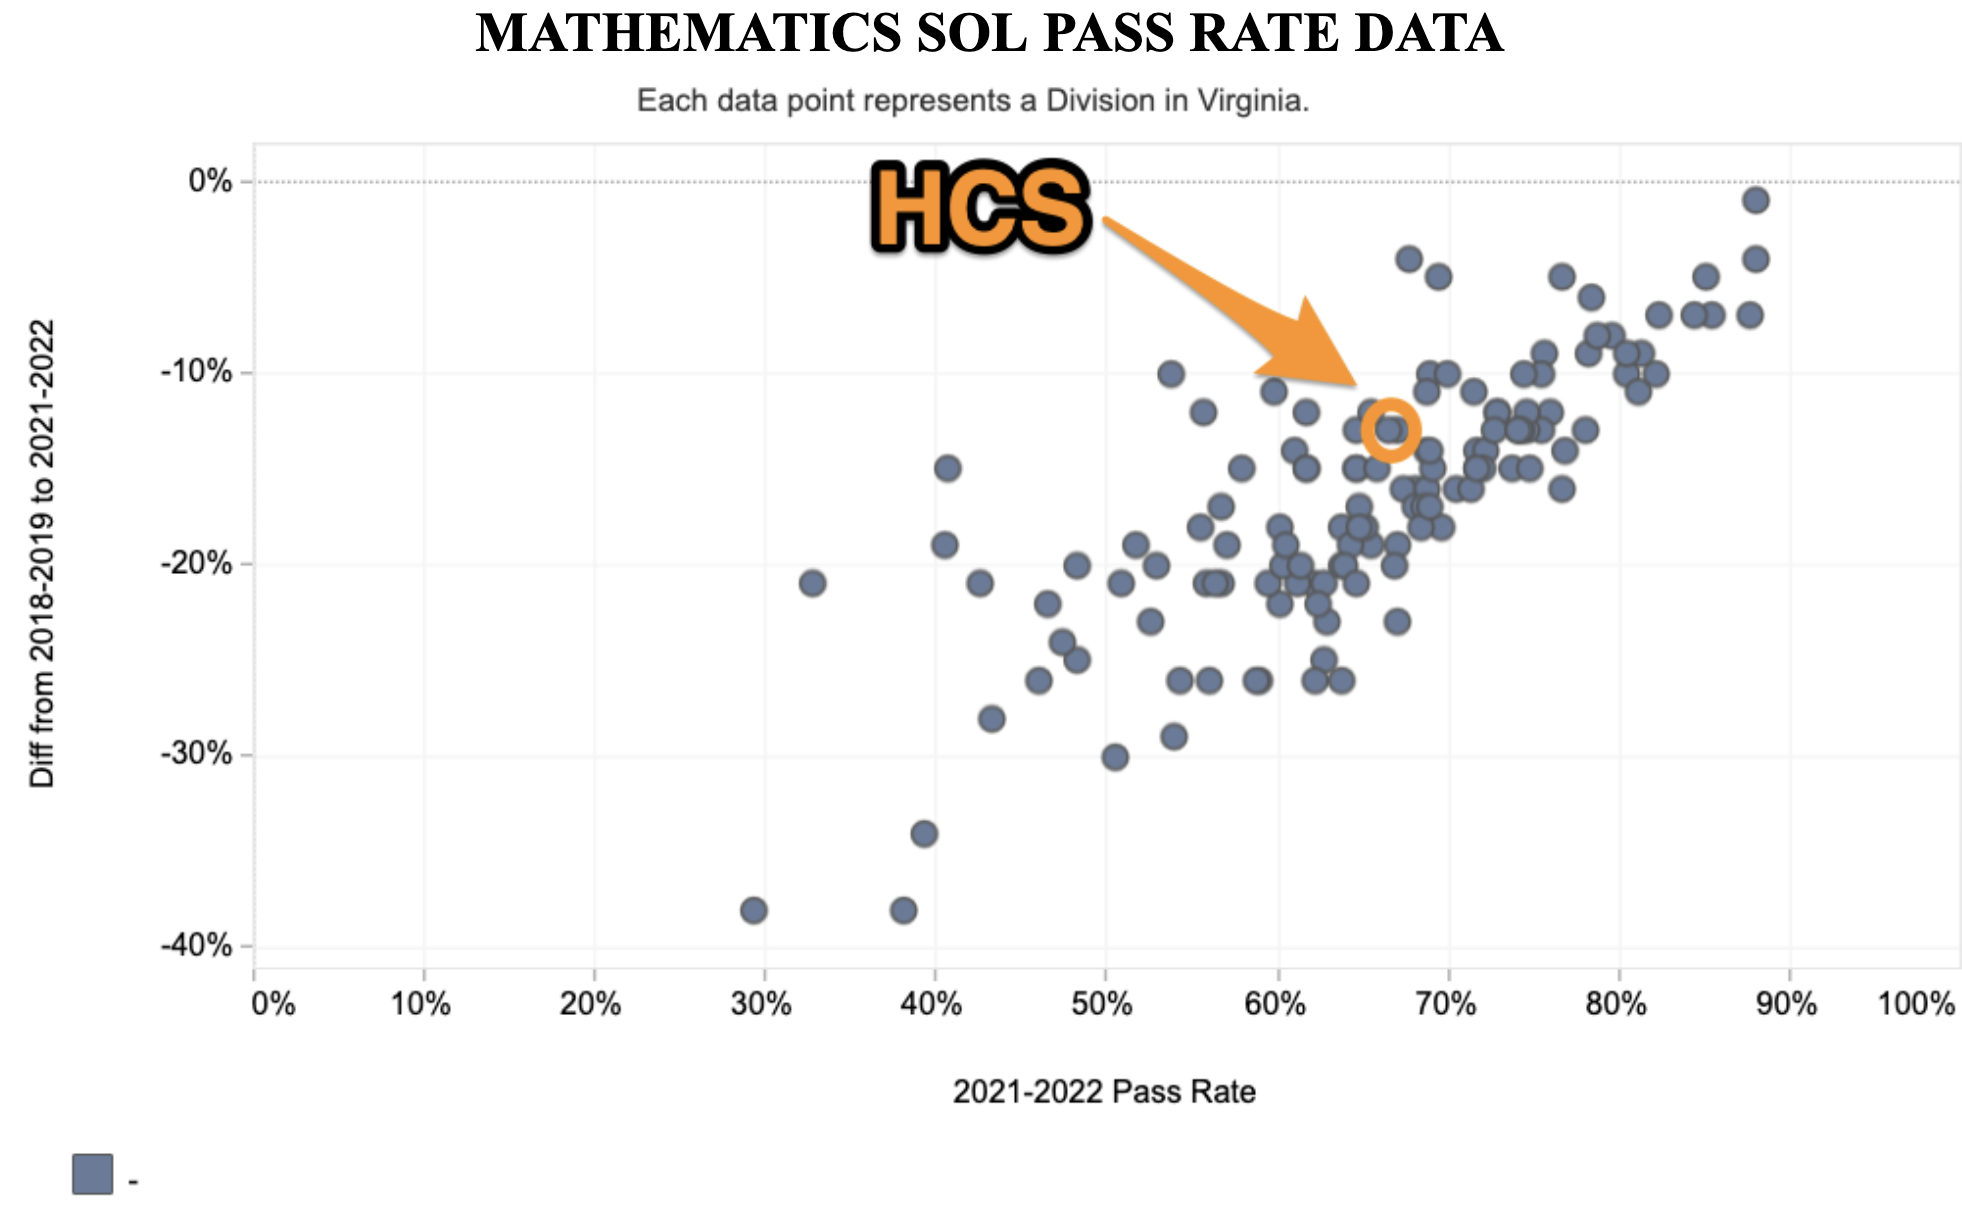
Math |
86 |
10 |
35 |
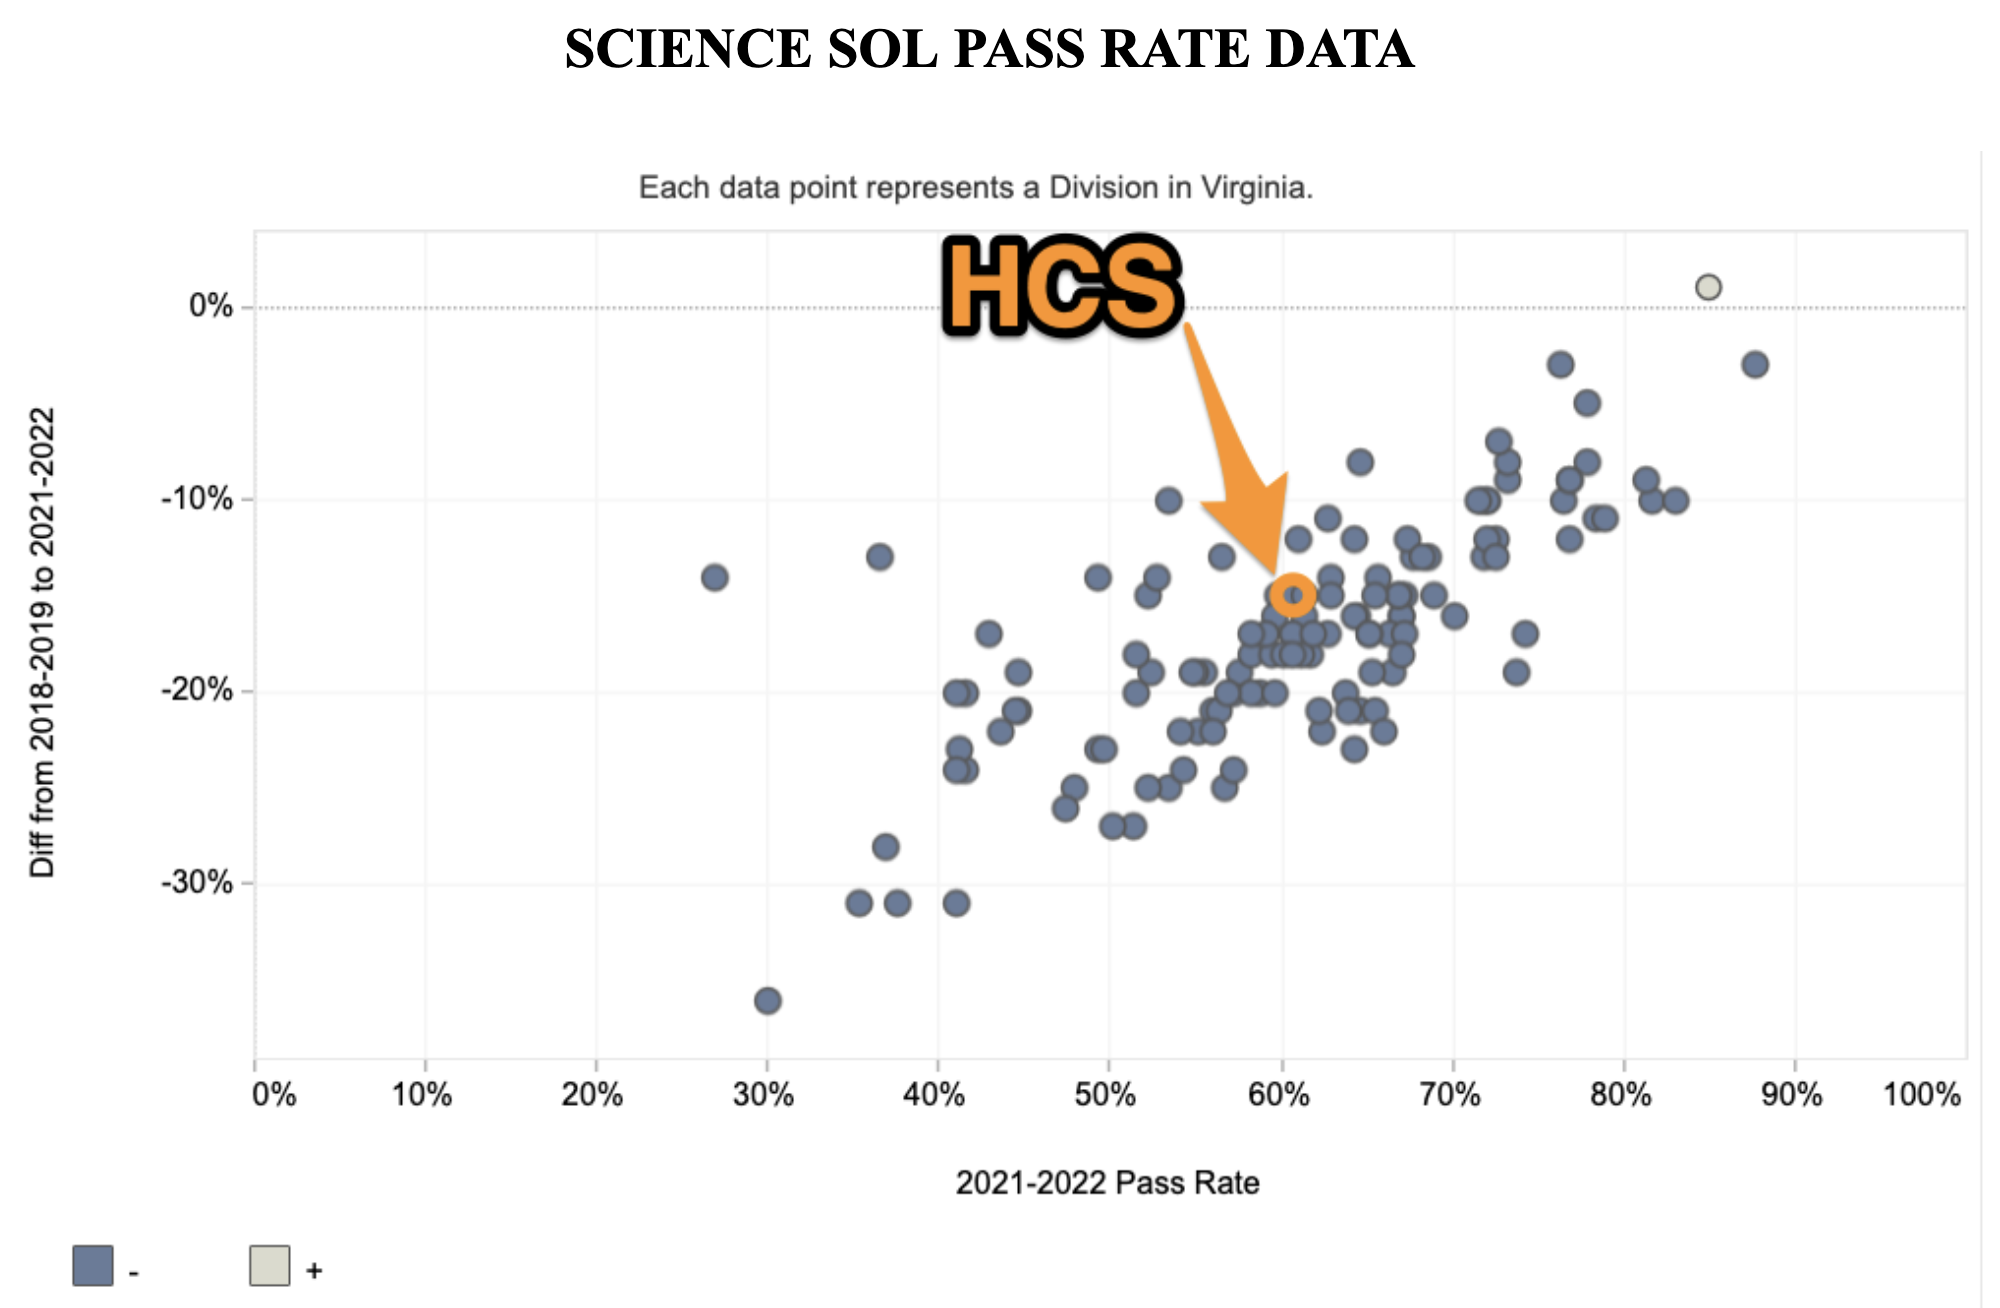
Science |
80 |
9 |
42 |
History & Social Sciences |
80 |
6 |
35 |
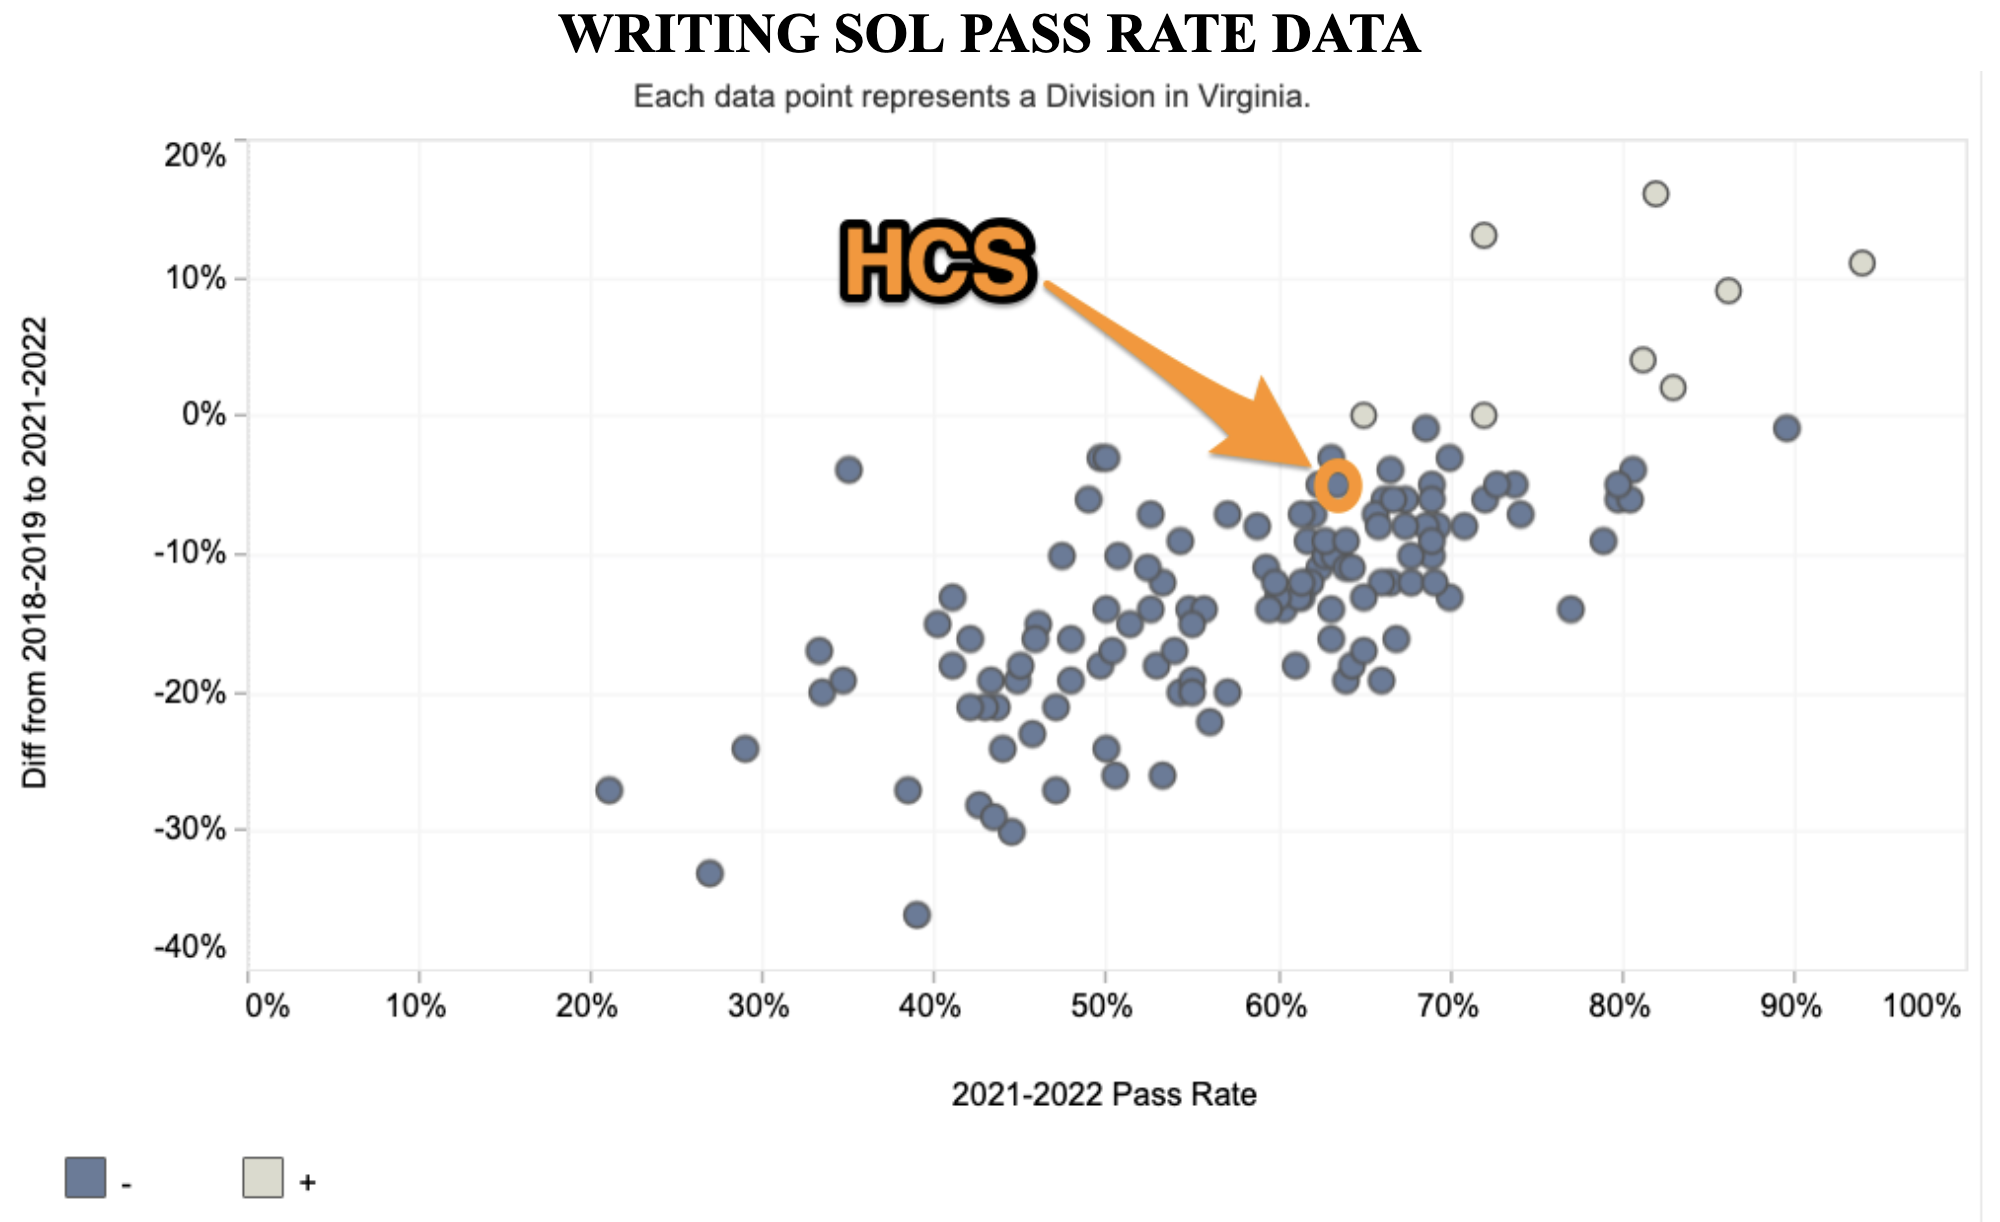
Writing |
109 |
5 |
17 |
The charts below represent the data in the table above. These scatter plots provide a visual representation of where HCS students performed academically in 2022 when compared to 2019 relative to other school divisions in the Commonwealth of Virginia. For example, the Reading SOL Pass Rate Data scatter plot below shows that 86 school divisions experienced a greater learning loss than Hampton City Schools and the Writing SOL Pass Rate Data scatter plot shows that 109 school divisions experienced a greater learning loss than Hampton City Schools.

Click here to view the Virginia Department of Education’s Learning Needs Dashboard.
![]()
© 2024 HAMPTON CITY SCHOOLS All Rights Reserved
ONE FRANKLIN STREET, HAMPTON, VIRGINIA 23669
757-727-2000
![]()
![]()
![]()
![]()